GDP Predictor
GDP Per Capita Predictor allows users to input data about a country that is easily accessible online such as, “phones per 1000 people” or “birth rate”. Using machine learning, it outputs a dollar amount indicating the predicted GDP per capita of the country. The data analysis and machine learning models the program uses determines the influence of different features on a country’s GDP. This can have important policy implications.
data science
machine learning
web app
personal project
supervised machine learning
regression
front-end
back-end
python
sklearn
pandas
numpy
plotly
flask
html/css/js
bootstrap
This app was created while on scholarship with National AI Camp, with colleagues Advait, Krish, Isaac, and Andria, under the guidance of mentor Serena Suni. We decided to create this application because it can potentially help others (particularly, in the government or public service sector) understand the influencing factors of GDP and which areas should be focused on to increase GDP.
The first stage of the project was determining how we can use Machine Learning to address a real-world problem. Several ideas were presented during brainstorming, including house price prediction, heart attack prediction, loan eligibility prediction, and more.
Eventually we settled on predicting GDP per capita for a country based on its available socioeconomic metrics. This was mainly because of shared interest amongst the team members but also because of availability of data—we were able to find a dataset of the average values of all relevant criteria for 227 countries for the 1970 to 2017 time frame. Specifically the dataset includes: Country, Region, Population, Area (sq. mi.), Pop. Density, Coastline (coast/area ratio), Net migration, Infant mortality (per 1000 births), Literacy (%), Phones (per 1000), Arable (%), Crops (%), Other (%), Climate, Birthrate, Deathrate, Agriculture, Industry, Service. One thing to note is that our dataset was relatively small (around 250 rows) meaning that we will probably need more data on GDP and our features to improve our model accuracy in the future. Additionally, our data had a significant number of null values, which we replaced with the median value by Region. This may or may not have changed the accuracy of our models.
We used a Supervised Machine Learning model to solve a regression problem as the set of data is supervised or labeled and the problem requires the prediction of continuous numerical values (GDP per capita).
Before training our models, we performed feature engineering to extract the features of the dataset that are most meaningful/impactful for predicting GDP per capita. For example, we discovered that Phones (per 1000) and GDP per capita have a strong positive correlation, while Birthrate and GDP per capita have a moderate to strong negative correlation.
We split our dataset into 75% for training and 25% for testing. We trained several different models, including Decision Tree, Random Forest, Stochastic Gradient Descent (SGD), and Multi-layer Perceptron Neural Network. For each, we tuned the hyperparameters.
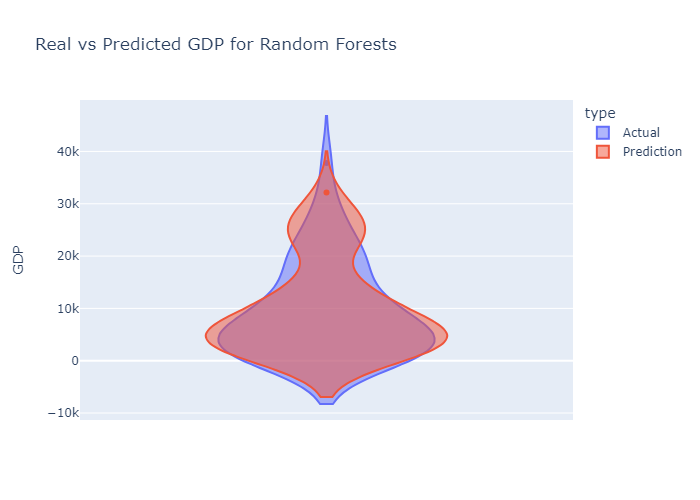
We evaluated each model using R-squared and Mean Absolute Error (MAE) metrics. We found that Decision Tree was often our best performing model with a final R-squared score of 0.80 and MAE of 2865. Random Forest was our most consistent model with a final R-squared score of 0.77 and MAE of 2885.
After model training and analysis, we created a website that features an interactive page where site visitors can enter metrics about a country and receive a predicted GDP per capita outputted by the Random Forest model we trained.
Eventually we settled on predicting GDP per capita for a country based on its available socioeconomic metrics. This was mainly because of shared interest amongst the team members but also because of availability of data—we were able to find a dataset of the average values of all relevant criteria for 227 countries for the 1970 to 2017 time frame. Specifically the dataset includes: Country, Region, Population, Area (sq. mi.), Pop. Density, Coastline (coast/area ratio), Net migration, Infant mortality (per 1000 births), Literacy (%), Phones (per 1000), Arable (%), Crops (%), Other (%), Climate, Birthrate, Deathrate, Agriculture, Industry, Service. One thing to note is that our dataset was relatively small (around 250 rows) meaning that we will probably need more data on GDP and our features to improve our model accuracy in the future. Additionally, our data had a significant number of null values, which we replaced with the median value by Region. This may or may not have changed the accuracy of our models.
We used a Supervised Machine Learning model to solve a regression problem as the set of data is supervised or labeled and the problem requires the prediction of continuous numerical values (GDP per capita).
Before training our models, we performed feature engineering to extract the features of the dataset that are most meaningful/impactful for predicting GDP per capita. For example, we discovered that Phones (per 1000) and GDP per capita have a strong positive correlation, while Birthrate and GDP per capita have a moderate to strong negative correlation.
We split our dataset into 75% for training and 25% for testing. We trained several different models, including Decision Tree, Random Forest, Stochastic Gradient Descent (SGD), and Multi-layer Perceptron Neural Network. For each, we tuned the hyperparameters.
We evaluated each model using R-squared and Mean Absolute Error (MAE) metrics. We found that Decision Tree was often our best performing model with a final R-squared score of 0.80 and MAE of 2865. Random Forest was our most consistent model with a final R-squared score of 0.77 and MAE of 2885.
After model training and analysis, we created a website that features an interactive page where site visitors can enter metrics about a country and receive a predicted GDP per capita outputted by the Random Forest model we trained.
Anyone who is interested can provide select socioeconomic factors of a country and receive a model-generated prediction of its GDP per capita.
undefined